
Each data important in the production area can be recorded. Requirements are determined conceptually. Classically, sub-parameters of your productivity in MES; your performance, quality, usability rates. Planned or unplanned maintenance times and all your maintenance data for your MTTR-MTBF records, which are important KPIs.
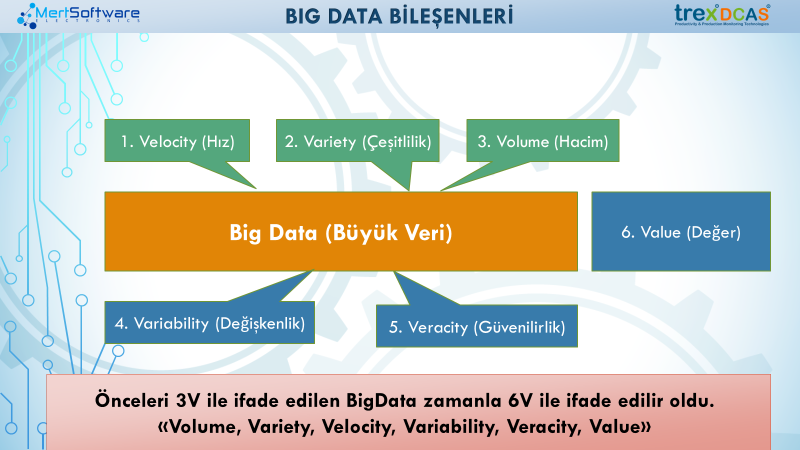
What is big data? This should be mentioned first. Components that create big data are;
Speed: Indicates the production rate of data.
Diversity: The types of data produced.
Volume: It is the main problem of big data. As data accumulates, there will be a need to increase capacity.
Variability: It is the transformation of data from one format to another. It can be exemplified such as the generation of text from the data matrix visual or the format conversion of image content files.
Reliability: Verification of stored data.
Value: The data received in the original form has a low value compared to the volume. However, it will be valuable by analyzing the data.

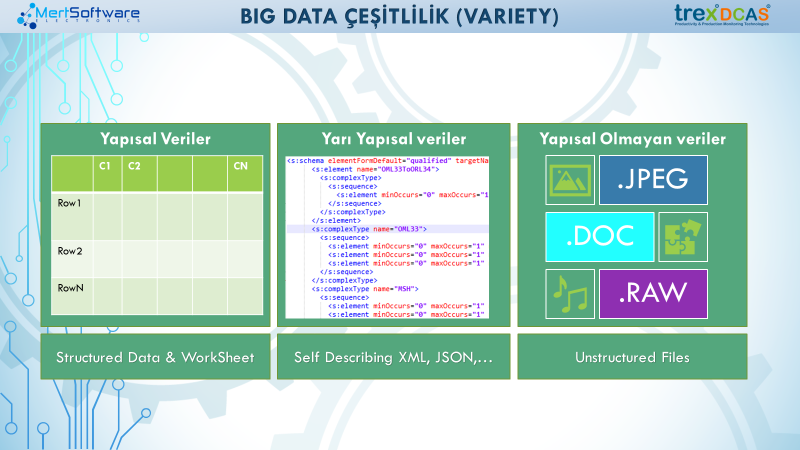
Structural data: Data whose model can be defined in advance, the input format is fixed and easy to store and query. Database tables, spreadsheets are examples of this.
Semi-structured data: Although similar to the structured data type, these are more flexible. Each new data contains its own model.
Non-structured data: Data that does not have a fixed format, such as documents, pictures, video e-mail messages. We can make unstructured data meaningful only by creating metadata with information such as file name date source.
Data are not entered into the system only through user interfaces. There are also various data collection devices included in the system (Sensor, Panel, OPC, PLC devices) or generated through reports generated by the warning system.

First of all, we have to talk about what data is and its importance. Simply, knowledge is the most valuable thing ever since ancient times. When asked what is the oldest known database in the world to date, it is predicted that many people will respond as Lotus.
Although it may seem so, the first database is the genetic database. DNA and RNA are the best examples of this. Data provide the continuity in businesses. Collecting data is just the first step.
The person who has the knowledge is powerful and the data is very important. However, collecting data is only the first step.
The next steps will make sense of your data and they are very important. When we say a system that continuously learns and develops by processing the collected data on certain models, we enter the world of artificial intelligence-machine learning applications. This is a very wide-ranging subject and it provides incredible acceleration in every sector it is used in. Instead of making decisions that will take days of analysis, you can create a system that can make decisions in seconds and suggest the right path. However, the unrecoverable time losses will also vanish. This can be considered as a digital assistant. It can examine any event from a very broad perspective, detect problem sources that you have never thought of before, and warn you before a problem occurs. This kind of high technology applications enable all processes and resources of the enterprise to operate more efficiently.
First, we should talk about automatic bottleneck detection. A system that finds bottlenecks in production will warn you before the bottleneck and take quick action on this issue. Thus, instead of learning from the reports received after production, you can get information without wasting time.
Second, it is used on speed recommendations. The system will look at your previous work history with a certain algorithm and give you the best speed.
As human beings, we are on the verge of a major technological development with Industry 4.0 in the future of artificial intelligence and machine learning. These are just the beginning. Amazing technologies to be developed and discovered are waiting for us.
We can say that OEE analysis is mostly used in MES. It enables us to obtain information about the instant or periodic progress of the factory, business center, line, station. It is the first stop on the way to the main cause. According to the analysis result, you determine your area of improvement and take the next step on the road to the main cause. For example, if you want to analyse a loss associated with a stoppage that affects usability, your 2nd step will be stoppage analysis. However, if you have a loss that affects performance, your second step will be the cycle time analysis or the cycle time pareto histogram. If your loss is due to quality, quality analysis will guide you as your second stage. In addition to all these, trend analysis will guide you when you want to follow and analyze trends in the relevant KPI values (Usability, Quality, Performance, OEE).
The benefit of the improvement after the action taken regarding your loss with trend analysis can be clearly calculated in advance and can be followed after the action. These are the main analyzes used in MES, and it is possible to create new analyzes by integrating different KPI calculation models used or developed by companies into the system. MES constitute the base of corporate data management in the businesses. As this structure develops, it makes things easier with its incredibly useful features and allows the business to recognize itself.
If the goal is to maintain production consistently, instant alerts or scheduled reports will be needed. Since data analysis directly affects decision making, reports and notifications must be produced with the right content at the right time. This depends on system resources and report design. Therefore, it may be necessary to study the site well and design new ones instead of ready-made template reports for optimum configuration. Reports should be easy to optimize and redesign.
It will enable people in the decision-making process to take action faster. Therefore, it can be said that the reporting service has a very critical importance.
If data with a wide variety of content and files in different formats can be summarized regularly, a meaningful new data will be produced. Isn’t that what we call a report? In systems with Big Data, it is not enough to produce reports with only sql queries.
In addition to the database server, either data generated by other sources and unstructured data should be easily reported.
Instead of static reports, it is expected to have conditional, reprogrammable reports when necessary, in other words to be dynamic, to support certain script languages.
There will be a need for tools with user-specific customizations and interfaces that even those who know some basic concepts can easily use. Not only reports, but also Andon Dashboard designs should be possible.
To summarize, it is important to be able to report the available data without difficulty and present it in current and common formats.
Case studies like this have been done in many factories. When technologies are integrated, the algorithm of integration becomes the only limit for you. It is possible to produce advanced integrated reports on each area you are integrated with. In this way, you can compare the planned theoretical data with the real data and have an idea of how the next planning should be done.
Another issue is that it allows your cost analysis to be made on reality. Cost analyzes are generally calculated without any loss, but the situation on shopfloor is not that constant. Losses in production seriously affect the cost of a product. However, by looking at the statistics of the productions in the past, it enables the business to make a more real cost analysis, to give more real time to its customer, to calculate the cost of gross production time and to give more accurate prices.